 Sol Associates
Position as at 12 October 2026
When I look at a duck curve as a developer, I check the ratio before the spread. The spread is the number everyone quotes.
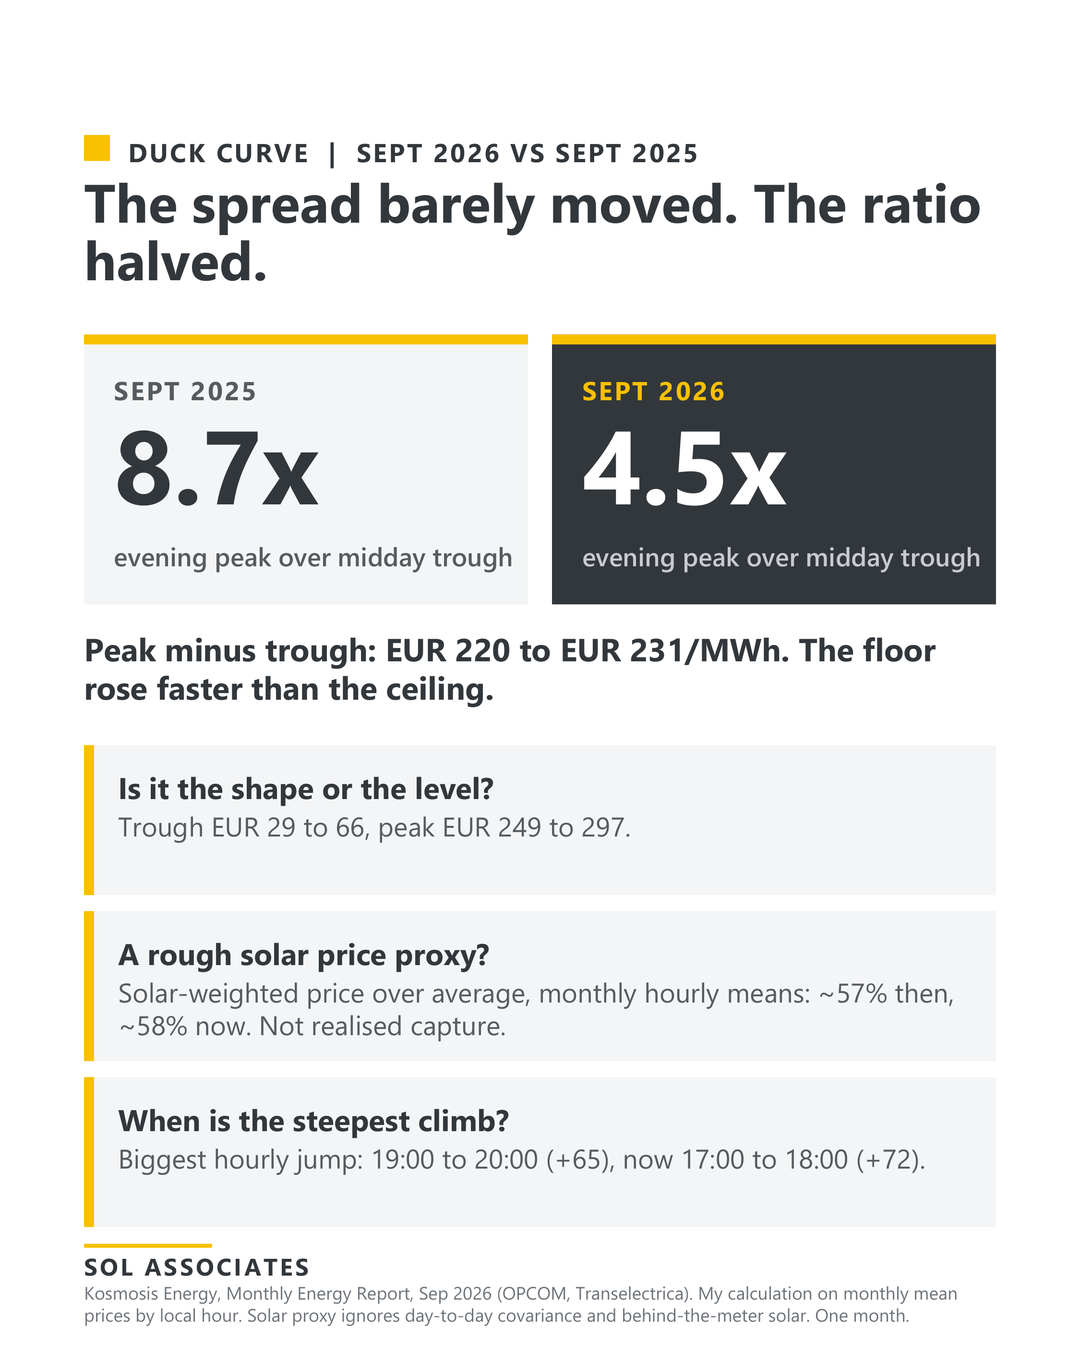
September 2026 against September 2025, Romanian hourly day-ahead: peak minus trough moved only from EUR 220 to EUR 231/MWh. The peak-to-trough ratio went from 8.7x to 4.5x, because the floor rose faster than the ceiling. That tells me whether the shape got more extreme or the whole curve simply moved up. Here it moved up.
Next, a rough proxy for what solar earned: the price weighted by grid-observed solar output, built from monthly mean hourly prices. It was about 57% of the average price in 2025 and 58% in 2026. That is not realised capture: it ignores day-to-day covariance and behind-the-meter solar, so on this profile I read it as little changed, nothing more. Solar output roughly doubled.
Last, the steepest climb. The biggest hour-on-hour jump moved from 19:00-20:00 to 17:00-18:00. Whoever sizes a battery cares about that hour.
One month, a nuclear outage in the mix, and a market that moved from hourly to 15-minute products. I would not extrapolate any of it.
Source: Kosmosis Energy, Monthly Energy Report, September 2026; my calculation on monthly mean prices.
Originally posted on LinkedIn: view the original post.
Day counts and deadlines are as of the post date; check the regulatory calendar for the current position. General information prepared from public sources, not legal advice. Read the disclaimer.